Unveiling Intrinsic Properties of Dusty Red AGNs (Click)
To date, ~1,000,000 active galactic nuclei (AGNs) have been found. These AGNs are found by using X-ray, ultraviolet (UV), optical, and radio observations. However, recent studies reported that up to more 50% of AGNs with very red colors could be omitted in the previous AGN surveys.
The AGNs with red colors are called red AGNs. In simulation studies, red AGNs are predicted to be in an intermediate phase between merger-driven star-forming galaxies, such as ultra-luminous infrared galaxies (ULIRGs), and unobscured type 1 AGNs. This scenario is supported by several observational results, such as (i) enhanced star formation activity, (ii) frequent occurrence of merging features, and (iii) young radio jet. However, this explanation for red AGNs is still controversial due to that the red colors of red AGNs could be also explained by (i) red continuum, (ii) unusual covering factor of hot dust, and (iii) synchrotron emission peak at near infra-red (NIR) wavelength from radio jet.
I have tried to understand intrinsic properties of red AGNs. The summarized results are presented in below.
Before studying intrinsic properties of red AGNs, I investigated which method is the best way to find dust obscured red AGNs suspected as the young AGNs. Red AGNs have been selected by various methods (e.g., optical color, NIR color, optical-NIR color, or X-ray hardness). Among them, I tested NIR (J-K>2 mag) and optical-NIR (g- K>4 and J-K>2 mag) color selected red AGNs.
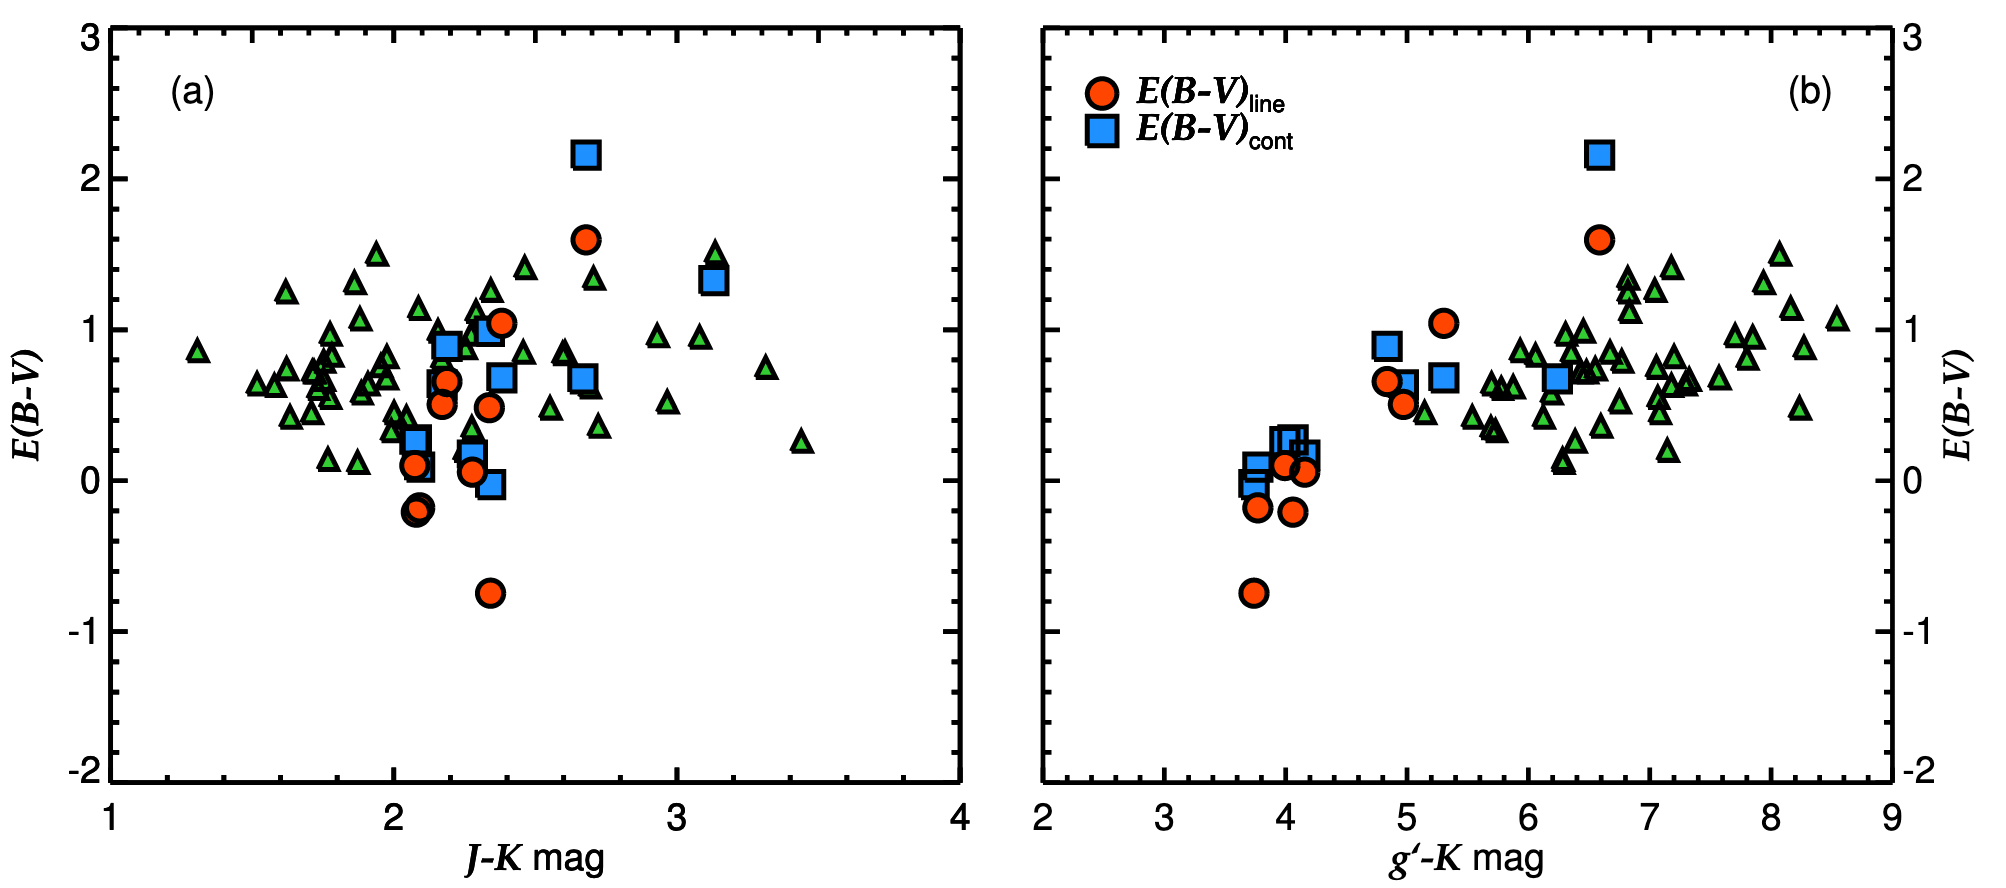
For this study, I performed several NIR spectroscopic observations by using Gemini/GNIRS, Magellan/FIRE, Subaru/IRCS, and IRTF/SpeX for 16 NIR color selected red AGNs at z ∼ 0.3. I estimated their E(B − V) values based on their continuum slopes and line ratios, and the measured two types of E(B − V) values are broadly consistent. However, some of the NIR color selected red AGNs are not affected by dust extinction. Therefore, NIR color selected red AGNs cannot represent the intermediate population between merger-driven star-forming galaxies and unobscured AGNs.
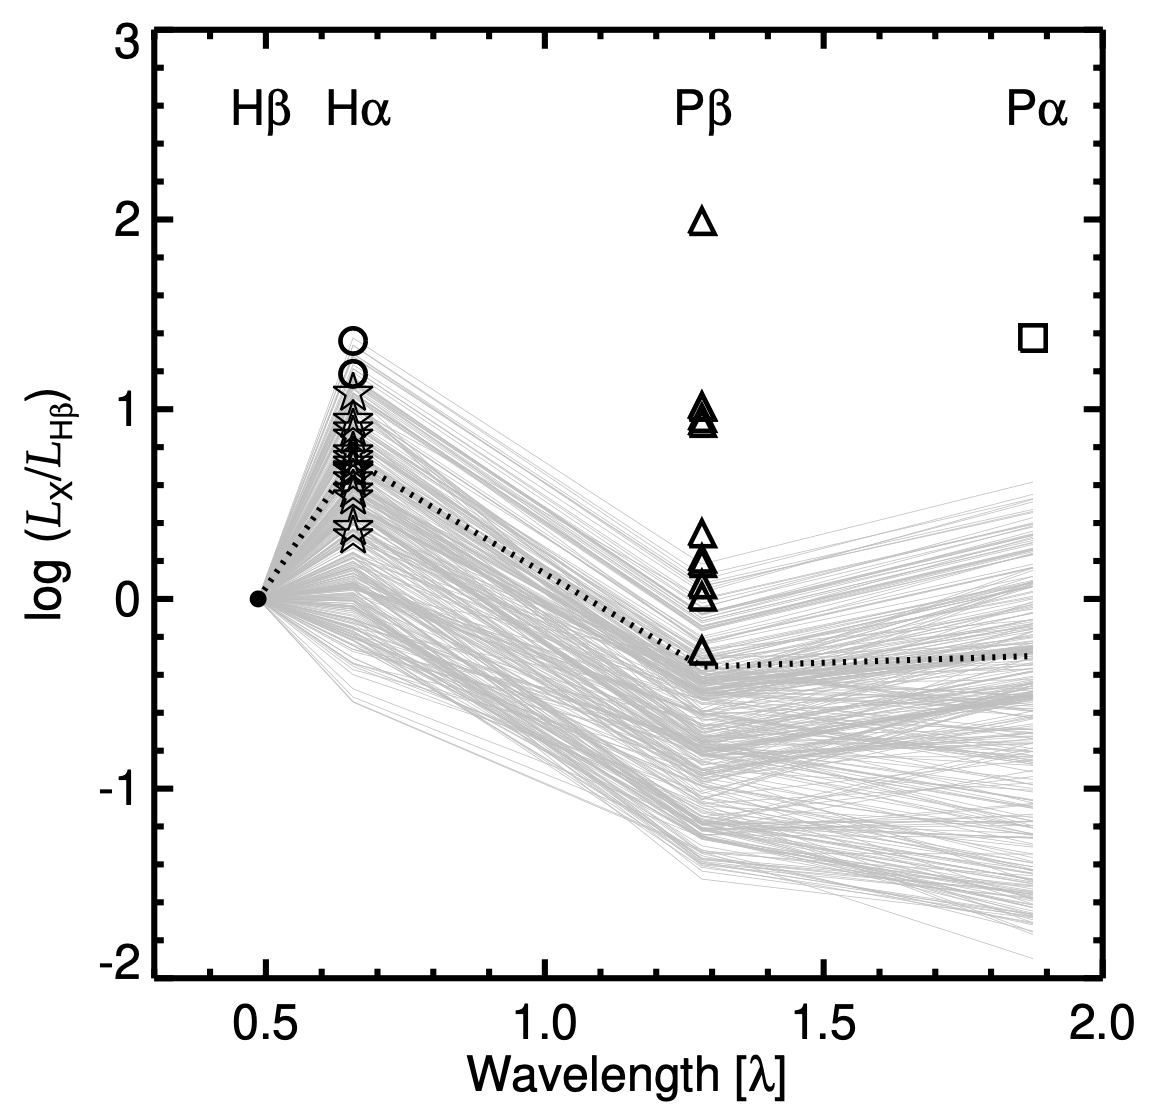
In order to investigate the origin of the red colors of optical-NIR color selected red AGNs, I used hydrogen emission lines from Balmer to Paschen series of 20 red AGNs at z ∼ 0.3 and z ∼ 0.7, which are selected by the well-known optical-NIR color criteria (g − K >4 and J − K >2 mag). For this study, I performed observations by using SpeX on NASA/IRTF, and conducted data analysis. The measured Pβ/Hβ flux ratios of the optical-NIR color selected red AGNs are found to be ∼10 times higher than those of unobscured type 1 AGNs, and the Pβ/Hβ flux ratios of a significant fraction of the optical-NIR color selected red AGNs cannot be explained by any theoretically feasible line flux ratios without adopting the dust extinction. These results are consistent with that the red colors of the optical-NIR color selected red AGNs come from the dust extinction, which imply that optical-NIR color selected red AGNs are the young AGN population.
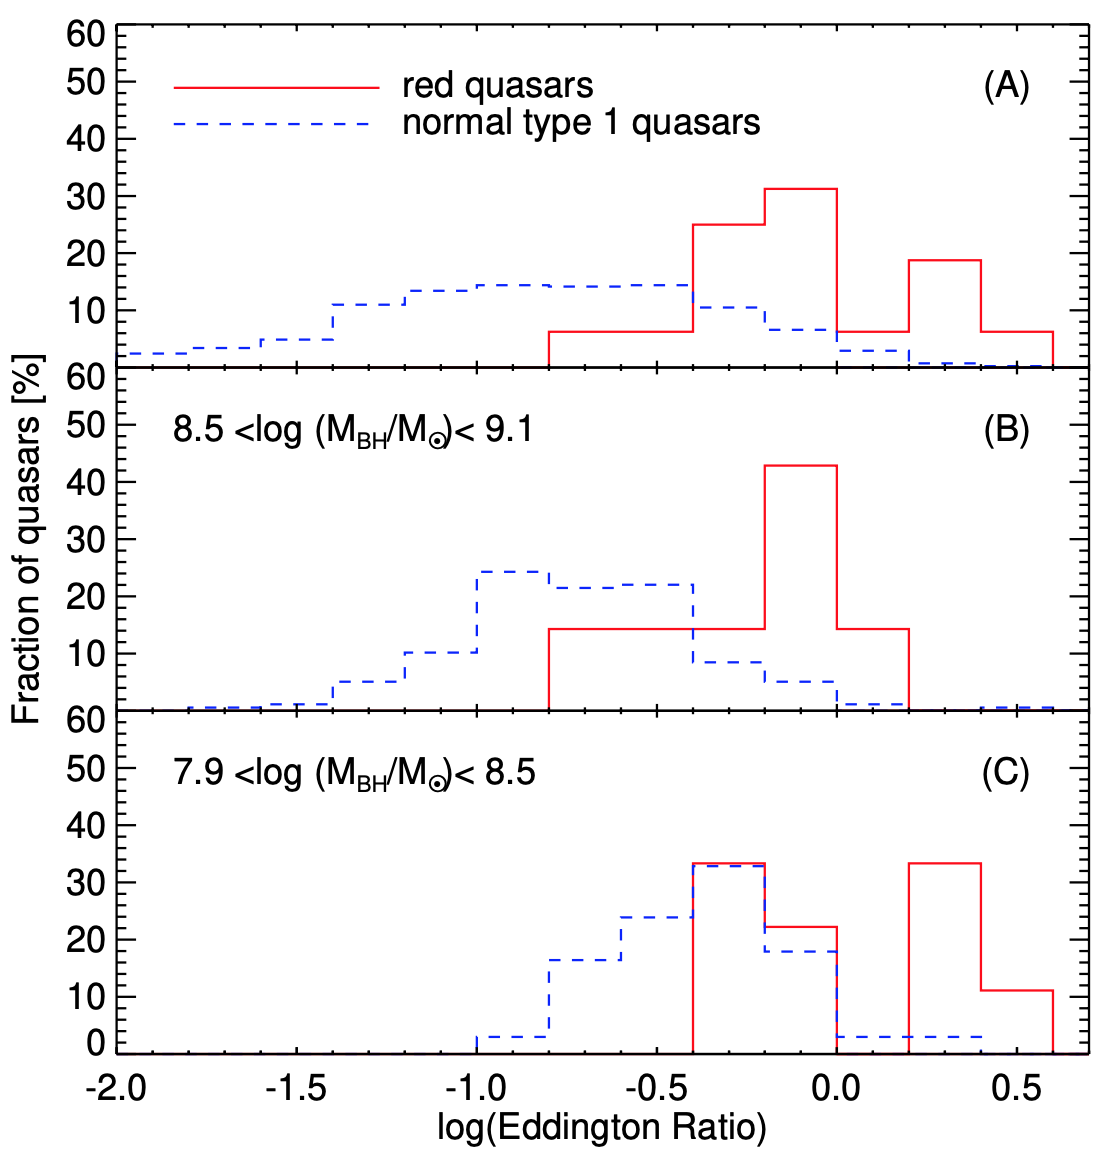
I found that the measured accretion rates of red AGNs are significantly higher than those of unobscured type 1 AGNs. In order to estimate the accretion rates of red AGNs, I observed 16 optical-NIR color selected (g − K > 4 and J − K > 2 mag) red AGNs at z ∼ 0.7 by using SpeX on NASA/IRTF, and conducted data analysis. The accretion rates are measured by the Paschen-line-based BH mass estimators from Kim et al. (2010) to alleviate the effects from dust extinction. The high accretion rates of red AGNs are consistent with the scenario in which red AGNs are the intermediate population between merger-driven star-forming galaxies and unobscured type 1 AGNs.
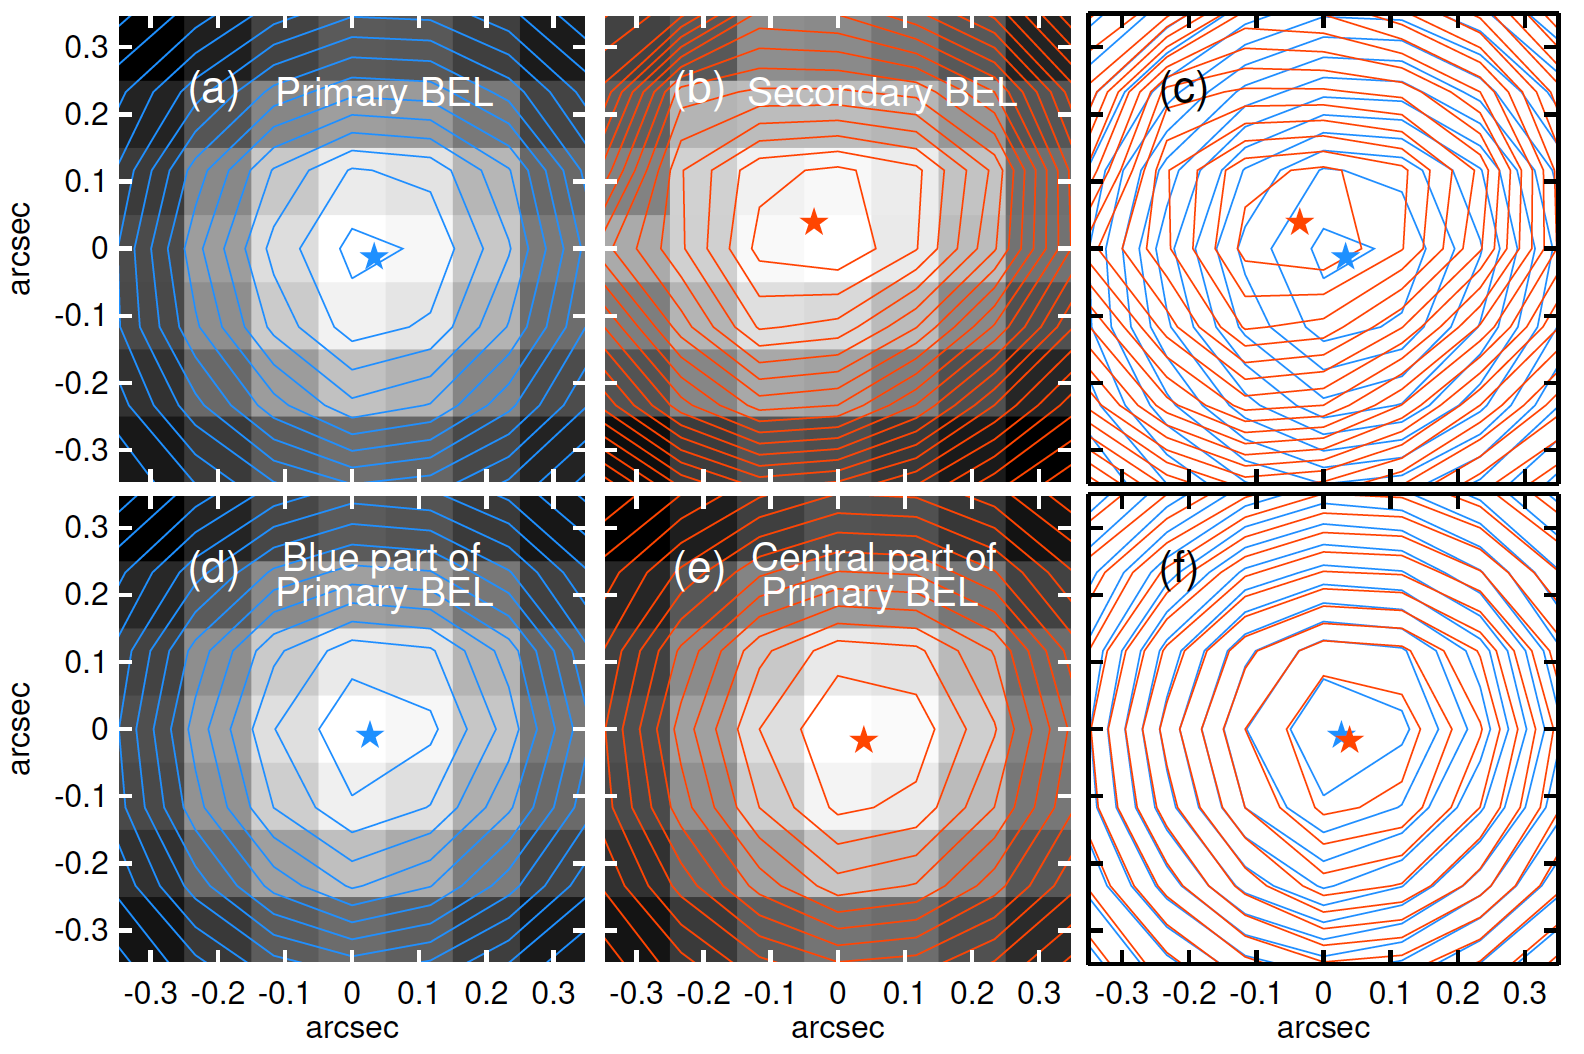
Since red AGNs are expected to originate from galaxy mergers, it is not peculiar that merging SMBHs are found in red AGNs. In order to find merging SMBHs in red AGNs, I selected a red AGN, 1659+1834, at z ∼ 0.170 owing to its double-peaked broad emission lines from Hβ to Pα and merging features in the HST imaging. However, the double-peaked broad emission lines can also arise from accretion disks, and the merging features cannot be the conclusive evidence for merging SMBHs. In order to probe the nature of 1659+1834, I performed an integral field unit (IFU) spectroscopy by using GMOS on Gemini, and conducted data analysis. The two peaks of the double-peaked broad Hα line are spatially separated at ∼250 pc, which implies that (i) red AGNs originate from galaxy mergers as expected in simulation studies and (ii) much more merging SMBHs could be found in red AGNs.